Shortly after the 2011 Boston Marathon, Steve Magness posted a link on Twitter to a series of videos of the top runners from this year’s race. The videos were all shot at 300fps with the same camera that I have used to shoot my own race videos, and they were posted on YouTube by elvin314. All were shot about 0.5 miles from the finish line, and all provide excellent glimpses of the running form of these elite men and women.
What I’m going to do in this post is provide an analysis of some stride timing data for these runners, with the goal of showing that even though these runners all performed exceptionally well, their gaits differ in some fundamental ways. I do this fully recognizing that this is a tiny sample of footage from the end of a very long race, so what I present here is by no means a definitive analysis of the stride of any of these individuals.
Here are the videos (I downloaded them with Keepvid and went frame by frame to obtain timing data):
Video 1 – Geoffrey Mutai (green singlet) and Moses Mosop (black/red singlet). Both have absolutely beautiful form. Lower leg is near vertical on ground contact for both, and both have a slight forward lean. Mutai is a midfoot striker, whereas Mosop is a forefoot striker. Mosop has a slightly higher arm carry, whereas Mutai drops his below his waistline a few times.
Video 2 – Gebre Gebremariam (green singlet) and Ryan Hall (blue/red singlet). Hall’s form is similar to that of Mutai – low arm carry, slight lean, midfoot strike. Gebremariam appears to have an asymmetry – forefoot landing on left, midfoot on right. He also has a very upright torso and almost seems to be tilting his head backward. Both have a very similar vertical orientation of the lower leg on ground contact.
Video 3 – Caroline Kilel (green singlet, closer to camera), Sharon Cherop (green singlet, farther from camera), and Desiree Davila (yellow/orange singlet). Kilel appears to be a midfoot to slight forefoot striker with a high arm carry and fairly upright posture. Cherop is a midfoot striker with a slight lean and a lower arm carry. Both land with the lower leg vertical at ground contact. Davila is heel striking and appears to be reaching out a bit with the lower leg (slight overstride). She has a moderately low arm carry, and a fairly upright posture.
Video 4 – Kara Goucher. Goucher seems to have a slight heel strike on the left and an even slighter heel strike to a midfoot strike on the right. Lower leg is nearly vertical on ground contact, arms are moderately low, torso is very upright, and head is tilting back like Gebremariam.
So those are my general observations on the stride of each of these runners – feel free to add anything I might have missed by posting a comment. It’s hard to know how much of a factor fatigue might playing here, and whether that might be contributing to some of the observable variations (e.g., the posteriorly tilted head of Goucher and Gebremariam), but it’s clear once again that there is no single gait that defines all of these runners.
Next we’ll take a look at some stride timing data. To do this I used Quicktime to determine the number of frames between various events in the video, then divided the number of frames by 300 to convert into a value in fractions of a second (the video was filmed at 300 frames/sec). The variables I measured were:
1. Length of Stance Phase – time from initial contact of the foot with the ground to toe-off of the same foot.
2. Length of Swing Phase – time from toe off of one foot to next contact of the same foot.
3. Length of aerial phase – time from toe-off of one foot to initial contact of the opposite foot. This represents “flight-time” or the length of time when neither foot is in contact with the ground.
4. Step Time – time from initial contact of one foot to initial contact of the opposite foot.
5. Step Rate (cadence) – number of steps per minute.
For each runner I calculated these timing measurements starting with the first observable contact of the left foot on each video, and where possible obtained data for both legs and computed the average (only swing phase in Mutai and Hall are based off just one leg). Below are the results (yellow depicts the highest value for each variable for each gender, green the lowest). Units for each value are seconds with the exception of stride rate, which is in steps/minute. The latter was calculated by dividing 60 by the value for step time.
|
Name |
Stance | Swing | Aerial | Step | Step |
| Time | Time | Time | Time | Rate | |
| Kilel | 0.180 | 0.468 | 0.142 | 0.322 | 187.4 |
| Cherop | 0.173 | 0.497 | 0.157 | 0.330 | 181.8 |
| Davila | 0.168 | 0.450 | 0.140 | 0.308 | 194.6 |
| Goucher | 0.195 | 0.422 | 0.115 | 0.310 | 193.6 |
| Mutai | 0.178 | 0.460 | 0.140 | 0.318 | 188.5 |
| Mosop | 0.138 | 0.508 | 0.185 | 0.323 | 185.6 |
| Gebremariam | 0.170 | 0.515 | 0.168 | 0.338 | 177.4 |
| Hall | 0.193 | 0.497 | 0.152 | 0.345 | 173.9 |
The data are somewhat hard to interpret without doing some formal statistical analysis, but a few interesting things pop out. First, female winner Caroline Kilel is comes out as middle-of-the-road for all of her timing variables when compared to the other women. In other words, she is not doing anything exceptionally fast or slow compared to the other top women. Given that her stride rate here is lower than that of Davila and Goucher, she must have a longer stride length than the others in order to compensate (this assumes that these data are representative of the entire race, which they may not be). Despite being a heel striker, Davila has the shortest stance time and the highest cadence. Goucher has a relatively long stance time, a shorter swing time, and has by far the shortest aerial time of any of these women at this point in the race.
Among the men, Geoffrey Mutai has a faster swing time than the others, and less aerial time (both feet off the ground). He also has the shortest step time, and therefore the highest cadence of any of the men. Mosop, a true forefoot striker, has the shortest stance time and the longest aerial time – he is the only runner here who spends more time in the air than on the ground. Ryan Hall has the longest stance time and a relatively long step time. His cadence is the lowest of any of the runners examined here.
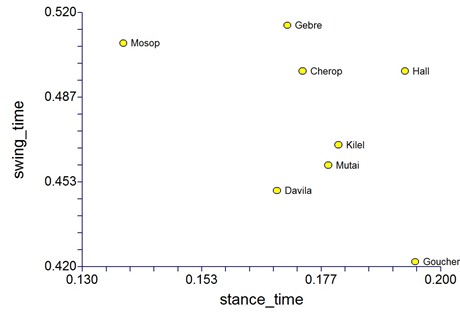
As an easier way to compare these runners, below is a scatterplot showing each runner plotted according to their values for swing time and stance time.
Mosop and Goucher come out at opposite extremes in this plot. Mosop has a long swing phase, short stance phase, whereas Goucher has a long stance, short swing. Interestingly, the male and female winners Kilel and Mutai come out very close to one another in this plot, suggesting that they share some similarity in their gait parameters.
I’m not sure what, if anything, all of this means, but it’s certainly interesting to put some numbers on the gaits of these elite marathoners. I need to digest this a bit before I can really say anything else, but I wanted to post it and see if anyone had any thoughts. If nothing else, it provides more evidence that even elites can vary considerably in their form – one need look no further than Mosop and Mutai. Both came in under world record time (though not record eligible), and they did so using quite different gaits, at least in terms of swing/stance/aerial timing. What’s strange is that if you look at the video of the two of them, their strides look almost to mirror one another. I initially didn’t believe the numbers I had recorded, but I went back and analyzed the video again and came up with the same results. When talking about differences in the hundredths of a second, it’s difficult to notice differences from stride to stride with the naked eye, but I suppose things can add up over the course of a 26.2 mile race….interesting stuff for sure…






Kilel and Cherop did a very good track, their standings are really close and nothing extraordinary, except for a slight time differences.
When shot 0.5 miles from the finish line I expect that some of the runners’ technique has started to break down, more on some than on others. It would be interesting to look at the technique early in the race too.
Absolutely. I’m working on film from a local marathon where I have
clips of the same runner from both miles six and twenty. Will be
interesting to compare.
Something you’ve missed is the stiffness in their stride, evidenced by the degree of knee bend upon impact. This is also apparent in how tall they look.
The Africans are much stiffer than Hall – he loses a lot of energy this way, and he also leans forward from his waist.
The best runners are “on top” of their stride.
I should see if I can take some angle measurements – not perfect film
for it, but not bad.
It might be useful to list the heights of each of the runners and also use this to compute the angle on stance to provide a form of normalized view of the stance. Cadence and runner height would also be something interesting to correlate. Presenting the times on stance vs overall stride time as a percentage would also be interesting. Estimated speed of each of the runners at the time of the video would also be a useful factor to list.
All of these suggestions revolve around trying to normalize the stats so that it’s we can better compare running gaits. For instance the tall runners will need a lower cadence than a short runner for the same running gait, that is, if one assumes the angles of the various body parts through the cycle being similar being a marker of similar running gait.
The impact of height is a great point. Ryan and Gebre are taller marathon runners as compared to most of the 5 ft. 2in. to 5ft. 4 in. runners so they don’t necessarily need as high a cadence and in fact it may be inefficient to do so at that height. I don’t know how tall Kilel is but the commentator kept referring to her long legs during the final stretch of the race. As a 6ft 1in. runner, I find it nearly impossible to learn all that much from much shorter runners. I tend to look at runner more around my height.
Lastly, Pete, based on Ryan’s data (at this point in time) would you say he has more vertical movement than the others?
“Lastly, Pete, based on Ryan’s data (at this point in time) would you say he has more vertical movement than the others?”
The best way to derive this from the footage is to use the time in the air and the a mathematical model of parabolic flight under gravity. I’ve done some quick maths, assuming that the toe off height and landing height are the same, the equation would be g * T * T / 8.
Admitedly not a perfect model given toe off and landing are likely to be a little different height, but it should be good enough to understand the basic relationsip – double the time in the air and you quadruple the height, this make sense as you have to launch twice as fast vertically, and it takes twice as long to reach the peak, multiple the two together and you get four times the height.
One can simplify it further and just say, the longer in the air, the higher the peak height. And for these runners Mosop has the longest time in the air and with it greatest vertical height achieved, and has 32% longer time in the air than Mutai, and with it a 74% higher maximum height. With the square law the height estimates will be very sensitive to inaccuracies with Pete’s time estimates, but the overall relationships are still solid. One thing I’d take away is that measuring height oscilation clearly isn’t a great indicator of performance – we have a huge variation here, but little actual performance difference or absolutely no consisent for this small dataset.
One should also be able to estimate the average loading on stance using the time in air vs time on stance. I’ll leave the calcs for another day though.
This is super interesting. I loved watching the videos. It just sort of frustrates me how little control I have over my own gait. I’ve read so much about good gait/form/posture but once I’m out there running everything happens so fast and so automatically.
This is great stuff. It would be interesting to see all these runners in the first 10 miles the middle 10 and then here. Some of your questions would be answered. The interesting numbers to me are aerial time and cadence as a ratio. It looks to me like there could be a Power Ratio here. Just look at Hall and Davila. Hall is not in the air and does not have the Cadence anymore so his Ratio is low. Davila is in the air even less but she is driving the cadence. She raced her way to second place with that drive.
Not sure how you would get these measurements, but how about gait analysis as it relates to the ratios of (1) thigh length vs total leg length, (2) lower leg (shin?) length vs total leg length, and (3) leg length vs total height. I bring this up because Hall and the Kenyans seem to have long legs relative to their height while this ratio for Davila and Goucher seem to be smaller.
This is the difficulty of analyzing race video – you can get timing data
easily, but distance/length measurements are tough unless you have a known
scale placed the same distance from the camera as the runners. Probably why
most gait studies are done in controlled lab situations. Personally, I think
looking at race video is more realistic and gives a better picture of what
runners actually do.
I’d be a bit cautious about taking more measurements from such a small sample, even if you don’t plan on a rigorous statistical analysis. The more variables you introduce, the more likely you are to stumble upon merely accidenntal correlations (“Kenyan athletes taller than 1.78m tend to have a slight limp, provided they wear a moustache”)
Great post Pete. I wonder how this compares to runners like Haile G., Bekele and Sammy W.
Would be interesting – we’d need high speed video to figure it out. Then you
add in variability due to course, location in race, etc. Makes me want to go
through my Boston videos from last year and do a detailed anaylsis. Would
take a long time, but would be interesting.
To me the big question here is how does all of this relate to efficiency? Isn’t that really what we should all be striving or “striding” towards. We will never be as fast as the runners in these videos but if we can find the most efficient form for our own unique bodies, then we will have found the form that lets us run farther and faster with less effort. To me this is far more important than how fast someone can run a 5k or a marathon because their things that our out of our control. Genetics being the biggest one. The trick is being able to find our own unique most efficient form. Maybe Mutai found his maybe not but that is what I will be running towards.
I remember Kara Goucher saying she was working on changing her running form last year and when she came back this year you would not recognize her!
Not sure what happened as her style still looks the same.
Did Alberto Salazar fail in his attempt to improve her form?
Kara ran a PR. We don’t need to define in our own terms what an improvement in form is. Her 2:24:52 was an improvement in performance and that after having a child in the interim.
footage from mile 16 or so would probably be ideal. form could be affected negatively by fatigue or maybe even positively by the final build/kick at .5 mile from finish…we run better when we are running fast.
probably not great to use the term “heel striker” negatively in all cases. even though davila’s heel might touch first, she is running so quickly that her impact is probably very close to her center of mass (and the important thing is placement of impact in relation to center of mass).
you can have a perfect midfoot striker with far higher impact than a heel striker if they are leaning back. the only way to be sure is to measure with a force instrumented treadmill like at UVA.
Just to be clear, it wasn’t my intent to use the term negatively here, but
rather just to point out that is where they are making contact. As you
indicate, we can’t say much more than that in the absence of force plates
and such.
Pete
Hi Eric,
“she is running so quickly that her impact is probably very close to her center of mass (and the important thing is placement of impact in relation to center of mass”
I believe the concept of landing close to the center of mass is a useful cue, but it’s a terrible metric to measure likely impact by – landing closer to the center of mass actually requires shorter time on stance to remain in balance and with it higher peak and impact loads.
“you can have a perfect midfoot striker with far higher impact than a heel striker if they are leaning back. the only way to be sure is to measure with a force instrumented treadmill like at UVA.”
I’m sorry but this is wrong. The impact with the ground will be higher for those leaning too far forward, not the ones leaning too far backwards. We have to balance our bodies when we run. The idea of a forward lean positively effect landing impact is a myth. As cue learning forward can help up a runners cadence, but it’s not a perfect way to do as it can easily lead to choppy high impact landing as well. You are better off using your arms to drive cadence and instead keep your body well balanced.
The critical thing for managing landing impact is landing with a bent knee. When running at a stready sate the only lean you should have is the lean required to balance the aerodynamic loads on the body. Any lean more or less than this results in extra moments on hips and prevent the runner from running relaxed and well balanced.
The variability among elites suggests that there is no one optimal gait, -at least not as defined by these variables- since we don’t see the elite runners converge on these variables.
This might mean that there is no single best way of running period (at least not as defined….etc). It might also mean that the elite has converged to a large degree already and the variability we see is just the wiggle room they have. In that case it would be interesting to see if the elite have converged on all these variables or only on some.
To find that out, we would need to see how these numbers compare with a group of experienced recreational athletes or semi-elites. Is there any footage of runners who ran the Boston marathon, say 3 hours?
I have footage of runners extending all the way to 6:00 marathoners
(from a different race), and your point is a good one. I ad already
planned on recreating the graph I posted with a few mere mortals for
context!
Of course, the sample is way too small, but if I were forced at gunpoint to draw a conclusion from the graph, it would be that the variability in swingtime and steptime in those with a high step rate is larger.
Mosop and Kilel have nearly equal step times*. If you draw an imaginary line between the points representing Mosop and Kilel, those under it have the highest step rate and those above it have a low step rate. The further they are from this imaginary line, the higher/lower their step rate.
The ‘cloud’ of the four athleteswith the highest step rate -those under or on the imaginary line- (i.e. Mosop Davila Mutai Goucher) is much more spread out (perpendicular to the line between Mosop and Kilel) than the cloud of athletes with a low step rate.
I’d be interested to see if this holds if mere mortals are added.
BTW love your blog and (as a result) bought me a pair of Kinvaras.
*)and step rates. There seems to be a slight error in the step rate of Kilel. 60/0.322 = 166.3
Rinie,
The error was due to the way I calculated step rate – it was from the mean
of step rates calculated independently for each foot, and not by dividing 60
by the mean step time. Thus, the discrepancy I think is because of rounding
error and the number of digits past the decimal used in the calculations. I
believe your correction should read 186.3, so not a big difference anyway.
Pete
Thanks, that explains it, and you’re right 186.3.
During my lunch break I derived a simple model of vertical GRF required to accomplish different time in the air and time on stance, and used the assumption of a sinusodal vertical GRF, which is a bit crude, but it does at least give us reasonable first pass approximation.
MaxVerticalGRF / Mass = 0.5 * PI * G * (ArialTime / StanceTime + 1)
The ratio 0.5 * PI (ArialTime / StanceTime + 1) is the interesting part for comparing running gait between runners, it’s also nice non dimensional unit which is ideal for factoring out sizes of runners from the analysis. This ratio represents the maximum G loading that the runners legs will be generating mid stance, there might be more appropriate naming for this ratio, but.. I’m not working from a text book so please forgive naming… hopefully you’ll get the idea.
For the runners in Pete’s table:
StanceTime ArialTime Est. Maximum G Loading
Kilel 0.180 0.142 2.8G
Cherop 0.173 0.157 3G
Davila 0.168 0.140 2.9G
Goucher 0.195 0.115 2.5G
Mutai 0.178 0.140 2.8G
Mosop 0.138 0.185 3.7G
Gebre. 0.170 0.168 3.1G
Hall 0.193 0.152 2.8G
I’ve cut down the number of decimal places in the my Max G loading ratio as I didn’t feel given all the assumption that more decimal places are warranted.
Variations in the shape of vertical GRF will be presentation in all these runners, none for sure will be match the sinusodal assumption I’ve used, so if we looked at real force plate values we’d see might see higher of lower figures than the ones above listed. I wouldn’t expect big differences though, certainly not enough to reign in the outliners like Mosop with his collosal 3.7G peak loading that he’s likely generating, you simply can’t escape having to generate high loads when you have such as short time on stance relative time in the air.
What is interesting about these G loading ratios is comparing them to the cadence, Mosop shows that a higher cadence alone doesn’t mean that loads are necceserily lower, it’s all down to the balance of time in air vs time on stance that is critical.
Wow. Am I right if I say that this would mean graphically that, if you rotate the graph roughly 30 degrees counterclockwise, you’d have a graph with maximum G on the horizontal axis and step time on the vertical axis?
I’m afraid I don’t follow you. Graphing state time against estimated max G loading would be interesting to plot, is this what you are trying to imply? Perhaps Pete could follow up with adding elements like estimate G loading into his analsysis.
My method for estimate max loading could also be put to the test for cases where time in air, time on stance and max loading is known, from this one could also tweak the PI/2 ratio so that it better reflects actual vertical GRF data rather than my sinusodal approximation. I’m confident that the (TimeAir/TimeStance+1) ratio will hold good.
This simple equation also shines a light on notion that landing close to underneath your center of mass as being nonesensical for lowering loads. If you landing close to your center of mass you reduce your time on stance and force up the max loading to compensate or reduce the time in air even faster – something that requires are rapid increase in cadence to achieve.
Efficiency is quite different from minizing loading though, shorter time on stance is often equated to greater running efficiency. However, the data in this blog and my own quick analsysis on G loading certainly don’t point to low time on stance being critical to getting best results. For long distance events like the marathon I suspect that advantages of keeping loading relatively low can compensate for lower efficiency of longer time on stance as it’s often muscle fatigue that gates performance rather than maximum power output or available energy reserves.
Sorry about being hopelessly unclear. I was a bit stuck on an idea I posted below. I am not really sure about it, but the point I was trying to make is this.
The graph shows on the axes swing time and stance time. However, there are other orderings hidden in the graph. For example, you’ll notice that the runners above and right in the graph have the highest step time, while the runners left and below have the lowest step time.
More precisely, if you’d align a grid with the x axis parallel to the line between Mosop and Kilel -the two runners with nearly the same step time- and the y axis perpendicular to it, you’d have the runners ordered from low step time to high step time along the y axis. In other wortds, if you tilt the whole graph roughly 30 degrees backwards, you get the rinners ordered accodring too their step time in the vertical axis.
I asked myself the question what ‘unit’ you would have on the horizontal axis (the line parallel to the line between Mosop and Kilel).
I noted that, if you’d take the line between Mosop and Kilel as an x axis, you’ll find the runners ordered from high G (Mosop) to lower G (Gebre then Cherop then Davila) to the three runners with 2.8 G (Hall, Kilel, Mutai who are all (roughly) on the same line), to the lowest G (Goucher) along this line.
While I don’t see a logical reason why this should be the case, it seems as if the runners are ordered according to the G units you calculated on the x axis of this tilted grid.
The most effective way to do something like this would be to use a
multivariate test like Principle Components Analysis, but I didn’t
want to get into that level of analysis in a blog post :) that would
give you a better picture of overall similarity using more than just
two variables
Things start to float when I stare too long at a picture :)
Skimmed the comments but did not see this question raised..what shoes are they wearing? In the first video those two don’t have any issues landing mid-foot. They are just a pleasure to watch. Sick. They seem to fly between touch downs. Their height is such that the footwear seems irrelevant. They are going to hit mid-foot in any shoe, even cowboy boots. Is this genetic or a learned gait?
Don’t know for sure on any except Davila, who is wearing the Brooks T7
Racer. The commercially available version of that shoe has a 12mm heel
raise, which is very high compared to most racing flats. As such, I’m not
surprised she is heel striking. That being said, I don’t know that her heel
strike is any impedance to her speed.
Pete
Man, I love watching these videos. To bad I’m not on that level yet.
Amazing stuff as always Pete. have no idea how you find time to do all this with a real job and kids. I posted on this on zero-drop as it relates to Davila
link to zero-drop.com
Maybe she is not really “striking” (just opinion)….we cannot see the forces. Anyway it is always fun to look at the data we can see on the camera as you have recorded Pete. some day we might know what this all means.
From the post:
“Think about what she is doing at this stage in the race. It is 25.5 miles in and they are running 5:20 per mile. She is using everything left to engulf the real estate between her and the Kenyans. This is not relaxing in the pack at 13 miles. She is reaching with all her might, recruiting every muscle/tendon unit, touching gently on her heel, rolling forward without losing momentum, extending her hips, loading the springs in her feet and Achilles, and gaining the ground with guts.”
Mark Cucuzzella
Hi, a common mistake made by people is that they assume all distance runners will land on their heel. This small observation as well as a number of papers proves this is not the case. The main difference between the fore/mid-foot striker and a heel striker is the joint moment around the ankle. As fore/mid-foot strikers land with their foot almost under their hip meaning the knee is more flexed which causes the joint moment to be pointing in the direction they are running. A heel striker lands with their foot further in front of their hip cause the joint moment to in the opposite direction they are running. This causes a small breaking force on impact. Heel strikers have to compensate this by hip extension during the stance phase. Fore/mi-foot strikers have completed this hip extension during the swing phase which places their foot under their hip. Mechanically fore/mid-foot strikers should be more efficient. Dont think it was coincidence two forefoot strikers won the marathon.
Jonathan
Hi Jonathan,
“As fore/mid-foot strikers land with their foot almost under their hip meaning the knee is more flexed which causes the joint moment to be pointing in the direction they are running. A heel striker lands with their foot further in front of their hip cause the joint moment to in the opposite direction they are running. This causes a small breaking force on impact.”
I would disagree with this assertion. I see no evidence that heel strikers land automatically land further in front of center of mass than fore/mid-foot strikes. While it is an often repeated mantra for promoting the fore/mid-foot strike I believe it’s myth.
The forefoot is in front of the heel, so for the same flexion of the knee the forefoot striker will land further in front of their center of mass. The forefoot striker will also for the same geometries of limbs during the gait cycle will have a longer time on stance and less time in the air. This is no bad thing as it will result in lower peak loads as well lower loading rate.
Both forefoot and heelstrikes create a breaking force on landing, you have to ensure that the ground reaction force you generate goes through your center of mass. The big difference between the two is that the forefoot striker is able to store engergy in their tendons and muscles that is released on toe off, so you get back a portion of the breaking force as well as the vertical force you experienced on landing. The elastic recoil also makes it possible to generate more vertical force for the same muscle activation. For these two reasons is why the forefoot strike it potentially more efficient than the heel striker.
Robert,
The data I have seen generally show that stance time is lower in forefoot
and midfoot strikers (e.g., Hasegawa et al, 2007), and Mosop has the
shortest stance and longest aerial phase of any runner in this small sample.
He’s also the truest forefoot striker of the group.
For me, a critical factor that is not oft looked at is the direction of
movement of the foot prior to ground contact. I’ve seen a lot of
recreational runners where the foot is still moving forward when it hits the
ground. This probably creates a greater breaking effect and scuffs the heck
out of the sole of the shoe – shoe wear is more a function of friction than
impact. I have a great video of myself from mile 20 of a marathon a few
years back where I do this, and you should see the soles of those shoes. In
more efficient runners, the foot has stopped forward movement or has even
started to pull back prior to contact.
Pete
Hi Pete,
“The data I have seen generally show that stance time is lower in forefoot and midfoot strikers (e.g., Hasegawa et al, 2007),”
This is what one would generally expect as well given the better potential for elastic recoil.
However, general trends are not indicitive of clear difference between forefoot/mid foot strike and heel strikers. There is a big overlap, there is no exclusivity on values of vertical on horizontal GRF, there are heel strikers that have short stance time, and forefoot strikers with long stance time. It’s time on stance that will largely govern how far the runner lands in front of their center of mass and the magnitude of horizontal GRF.
” and Mosop has the
shortest stance and longest aerial phase of any runner in this small sample.
He’s also the truest forefoot striker of the group. “
Mosop is the big outliner in this data, his max G loading is far higher than any of the other runners. The type of foot landing will be part of the reason, but it’ll only explain a bit of large difference. Even with a heel strike Mosop would like still be running with high stiffness and generating high forces.
The rest of the athletes in your sample are either heel strikers and the mid-foot strikers and have pretty similar max G loading between them compared to Mosop.
“For me, a critical factor that is not oft looked at is the direction of movement of the foot prior to ground contact. I’ve seen a lot of recreational runners where the foot is still moving forward when it hits the ground. This probably creates a greater breaking effect and scuffs the heck out of the sole of the shoe – shoe wear is more a function of friction than impact. “
I would suggest this is symptom of overstridding, where the lower leg hasn’t been sufficiently slowed down by the ham strings on follow through of the leg. Slippage on landing can happen when heel striking and landing on your forefoot – I particularly notice a little slippage when landing on my forefoot/midfoot when racing down hiil on gravelly trails. I guess this might be sign of reaching a little too far with the foot as much as not getting my muscle tunning quite right to deal with the gradient, terrain and running speed.
Hi Pete et. al,
Here’e a great video og Ken Bob recorded at the Harvard Skeletal Biology Lab:
link to youtube.com…
Ken is running much slower in this video than lead Athletes at Boston so I wouldn’t want to compare the two sets of videos. I would like to draw the attention of readers to this video as it gives an example of forefoot/mid-foot strike that is done with an long time on stance, in fact Ken couldn’t really lower his time in the air any lower as it’s almost zero already. Ken is running about as low impact as one could possible do so, if you want to minize loading Ken’s form is where it’s at.
Ken shows better than any theory that forefoot/mid-foot strike does not equate directly with landing closer to the center of mass or short time on stance. At the other end of spectrum we’ll find the top sprinters, and inbetween we’ll have everybody else, heal strikers and forefoot strikers included.
With such variability in running form possible with the forefoot/mid-foot strike I would encourage runners not to generalize from small datasets or dogma’s that are sadely plaging the debate.
Thanks a lot for this analysis. Do you have, by any chance, something similar but for the 10 km run? I’m searching for stride length, stride frequency, contact times but for elite 10 km runner. Or do you have videos like the previous ones? Or any other reference?
Unfortunately no, nothing for 10k.
Thank you any way! :D
You should’ve analyzed Kim Smith. She has a very, very awkward stride, with irregularly high cadence considering her height (5’9?) and running on tip-toes.
Unfortunately I did not shoot these videos as I was running in the race. I believe Smith had dropped out before she reached the location where these were taken.
Pete
thanks for posting this Pete. interesting reading as are many of the comments. as others say it would be interesting to see the same sort of thing for mere mortals and for different distances. I was surprised by the apparent (quite large) variations in the data