Introduction
This is the second part of a series of blog posts about the RunLAB fullbody running analysis offered by the Swedish running shoe company Salming. The first post, which was published on The Running Swede Blog, was mostly a general description of the RunLAB and the general experience. This post will focus more on the technology used in the RunLAB, the biomedical parameters which are captured, and the outcome of my own analysis.
It is usually recommended to attend two RunLAB sessions. The first one will identify aspects of the running form which can be improved. Based on these findings the runner will be given suggestions for form changes or special exercises. The second session is typically a couple of months later to see if improvements in running form have been made. Originally, I planned to write this post after such a second visit. Unfortunately, a recent marathon resulted in acute plantar fascia issues which so far have prevented me from re-visiting the RunLAB. This means that this post has to live without an assessment of whether I have actually improved my running form or not after my initial analysis (but some information about how a friend fared is given at the end of the post). I hope to be able to provide this information in an injury-free future.
Technology
Salming currently has two permanent RunLABs in the Swedish towns of Gothenburg and Stockholm (in the US the technology was also showcased at the 2015 Running Event (more info here).
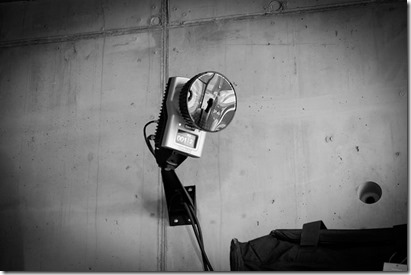
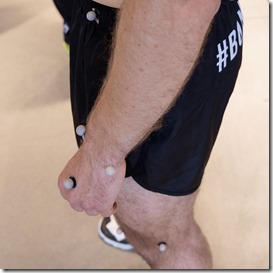
The basis of Salming’s RunLAB is a treadmill-based motion capture system. The treadmill is a professional grade model from the Swedish company Rodby. The motion capture system is from Qualisys (yet another Swedish company). In the Gothenburg RunLAB this treadmill is located in the centre of the Salming flagship store. On the walls surrounding it, there are eight special high speed motion capture cameras (see Figure 1) which can take images at 400 frames/s. Attached to each camera is a strobe which emits infrared light pulses which are invisible for the human eye but can be detected by the camera. These pulses are reflected by a total of 35 reflecting markers which are attached to the runner’s body at key locations (see Figure 2), usually at “bony” places close to joints, but for example also on the forehead. By combining the two-dimensional images from all eight cameras the motion of all 35 markers in a three-dimensional space can be recreated. With the help of the very high camera frame rate this allows a very precise analysis of full-body motion during running.
In a post-processing step, this data is then analysed for key biomechanical parameters such as
cadence;
step length;
ground contact time;
flight time;
pelvis height, obliquity, tilt and rotation;
knee angle;
ankle flexion;
foot rotation (pronation, supination), and contact (heel, mid foot, forefoot);
frontal/sagittal ankle path;
shoulder–pelvis flexion, lateral flexion, rotation;
elbow angle, and path;
wrist path; and
contact in relation to centre of gravity.
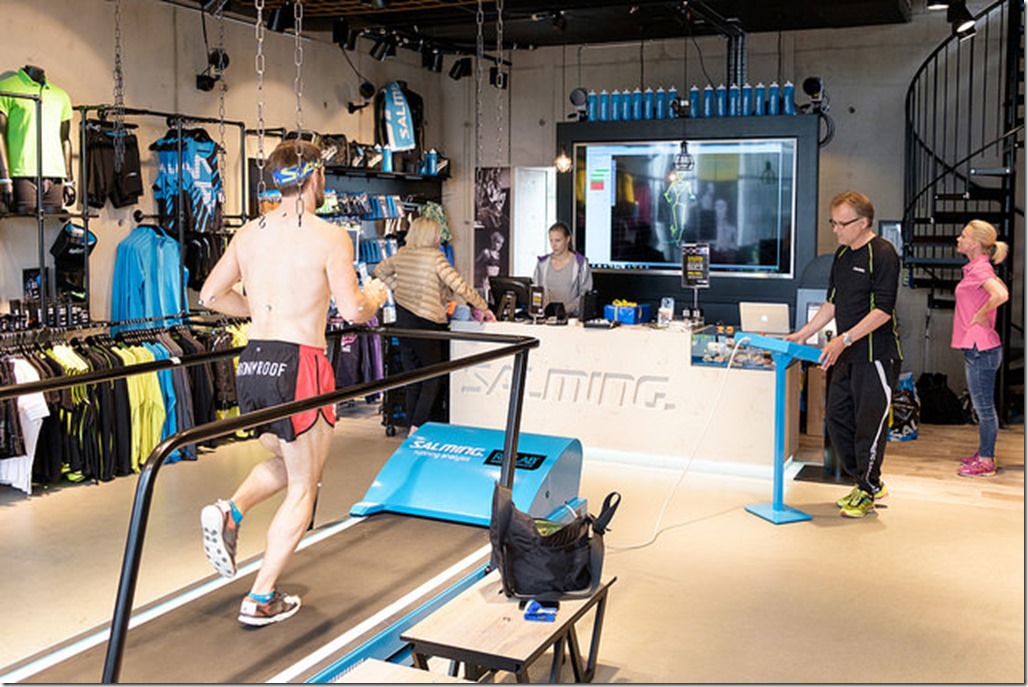
Figure 3: The RunLAB treadmill in the centre of the Salming flagship store in Gothenburg. While doing the analyses you can actually see a running skeleton of yourself at the big screen in front of you.
Each RunLAB session has the runner being filmed for a couple of minutes at three different speeds which are chosen based on a recent 10k race time (see Figure 3). In addition to the filming, the runner is also critically observed by a trained running coach from Salming’s RunLAB team.
After the results are compiled into sets of animations, pictures and diagrams, the coach goes through all results and explains them to the runner. As a normative reference, the data is also compared to the average results of large number of tested Swedish elite runners. Based on the data analysis, a few key areas in which running form can be improved are identified. This might also involve the runner doing another session of running or doing some other exercises under the scrutiny of the coach.
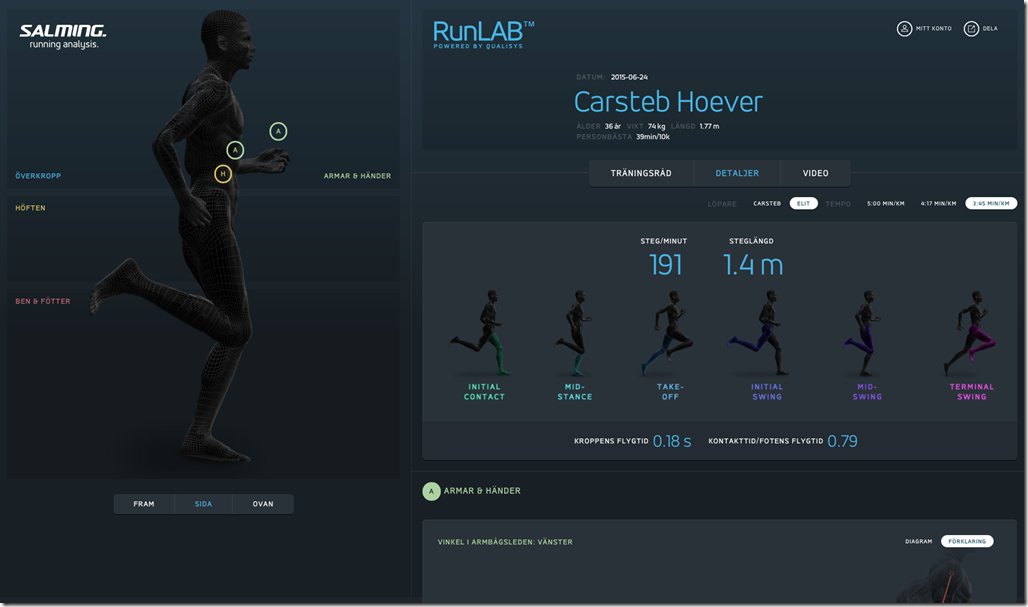
Before finishing the session, the runner is also given some hints on how to work on the problematic areas. A couple of days after the session the runner receives a link to a detailed web report, see Figure 4 for a screenshot (a full example in Swedish can be found here), which presents all the data in a very descriptive way. More importantly, the web report also contains information about the identified weaknesses and some suggestions for corrective exercises. Note that the layout of the web report will change in the coming weeks; the idea is to align it more with Salming’s so-called Running Wheel philosophy.
Figure 4: Screenshot of the Swedish web report. And yes, they got my name wrong. ;)
My case study
The most insight into the full body running form analysis is probably given by going through the results of an exemplary RunLAB session. In this case my session shall serve as such an example. Due to the extensive nature of the full analysis, it is not possible to go through all recorded parameters in this post. Instead, I will focus on a few parameters which cover the complete range from “totally normal” to “surprising” and finally, and probably most interesting, to “problematic”. In case anyone is interested in seeing my full results, this is the webreport (again unfortunately only in Swedish).
Note: the following images are taken from a PDF version of the report which was provided to me by Salming for the sake of this blog post. The PDF is neither as nice looking nor as informative as the normal web report (see linked examples above) and only includes the raw data and no further analysis, but at least it is in English (which is seen as big advantage for the sake of this post!).
Here are some of the key findings:
Stable, symmetric core motion
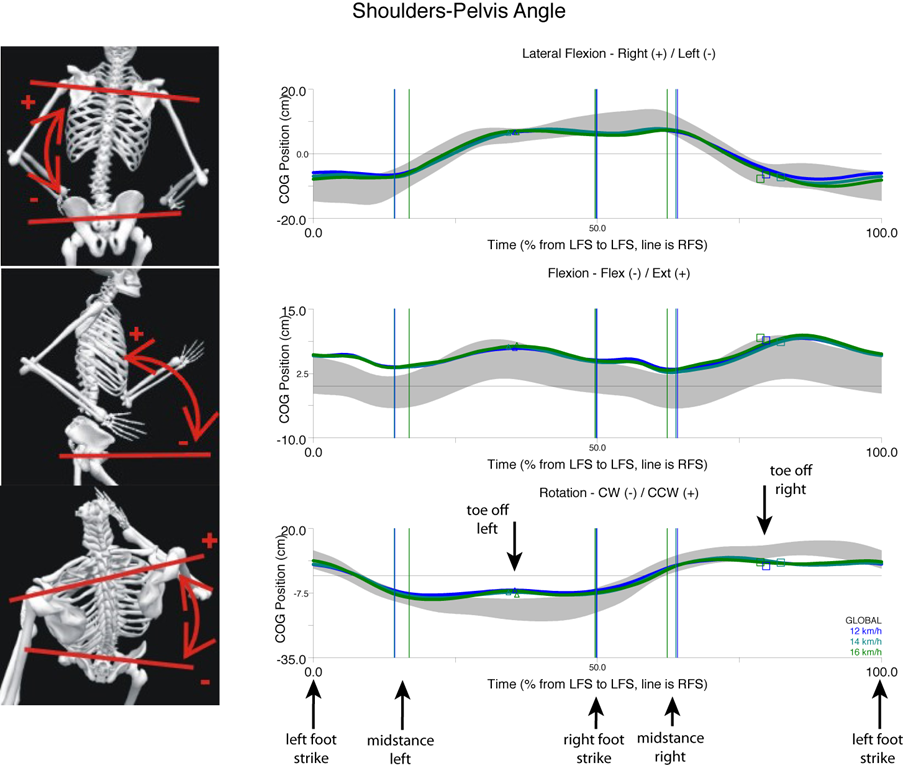
We will start with something very boring, a part of my running form which actually is pretty “normal”, the shoulders-pelvis angles for the (lateral) flexion and the rotation. As shown in Figure 5, my results (the blue/green lines) are pretty much in line with the Swedish elite runners results (the grey area). My flexion is probably on the edge of being too high, but not in a way that this is something to worry about. Something we will come back to later is that my shoulder-pelvis rotation is a little bit too small at lift-off.
Figure 5: Results for the different shoulders-pelvis angles. COG is centre of gravity, and LFS and RFS are left and right footstrike, respectively. The blue and green lines are my results for the different speeds, and the grey shaded areas are for the reference. Arrows added by the author for clarification.
Heel striking – Do I or Don’t I???
Popular belief often has it that the root of all running injuries and inefficiencies can be found in two causes related to the feet: (over-)pronation and heel striking. Interestingly enough, there is not only a lot of confusion about the general importance of these features, but also a wrong self-assessment by many runners who put themselves into certain footstrike or pronation-related categories with firm conviction. The RunLAB analysis gives you all the data to finally prove these beliefs…or to shatter them. For the sake of brevity, I will only focus on the footstrike in this post and leave the pronation results out.
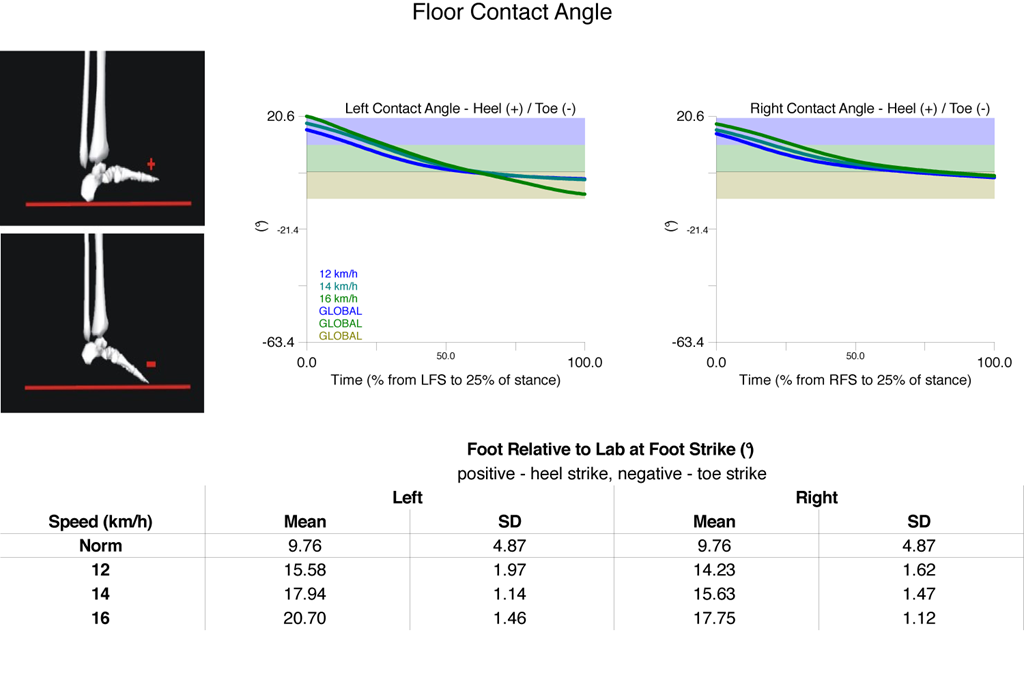
I am what some people would call a midfoot striker, i.e. my foot touches the ground more or less flat and simultaneously with both the heel and the forefoot. There is no discussion about this, that’s how it feels when I run and that’s what the wear patterns on my shoes indicate. Only…it is not true, as is shown by the measured floor contact angle in Figure 6.
For both feet initial contact is clearly with the heel, and not even close to an angle at which it could be classified as a midfoot strike (the green area in the plot). People often claim to “get on their toes” at higher speeds, but for me this is not the case: the foot contact angle gets bigger (i.e. I am more dorsiflexing/heelstriking) at higher speeds. There is an interesting asymmetry between my left and right feet: dorsiflexion at footstrike is consistently higher for the left foot, and only at the highest speed for the left one am I getting into a large negative floor contact angle (i.e. larger ankle plantar flexion). I wonder if this is the reason why, when racing, I tend to get hot spots at the tip of my toes, but only on my left foot.
Figure 6: Results for the floor contact angle. LFS and RFS are left and right footstrike, respectively, and SD denotes the standard deviation. The lines are my results for the different speeds, and the colored areas show what classically would be classified as heel striking (blue), midfoot striking (green), and forefoot striking (beige).
So, now that I am officially a heel striker, does that mean that my injury risk is larger? Most certainly not, for this it is for example much more important where my foot hits the ground in relation to the pelvis. Obviously, the RunLAB analysis also includes this data. However, I will spare you the details now (which can be found in the linked web report) – it should be suffice to say that my running form is fine in this regard.
Sitting all day
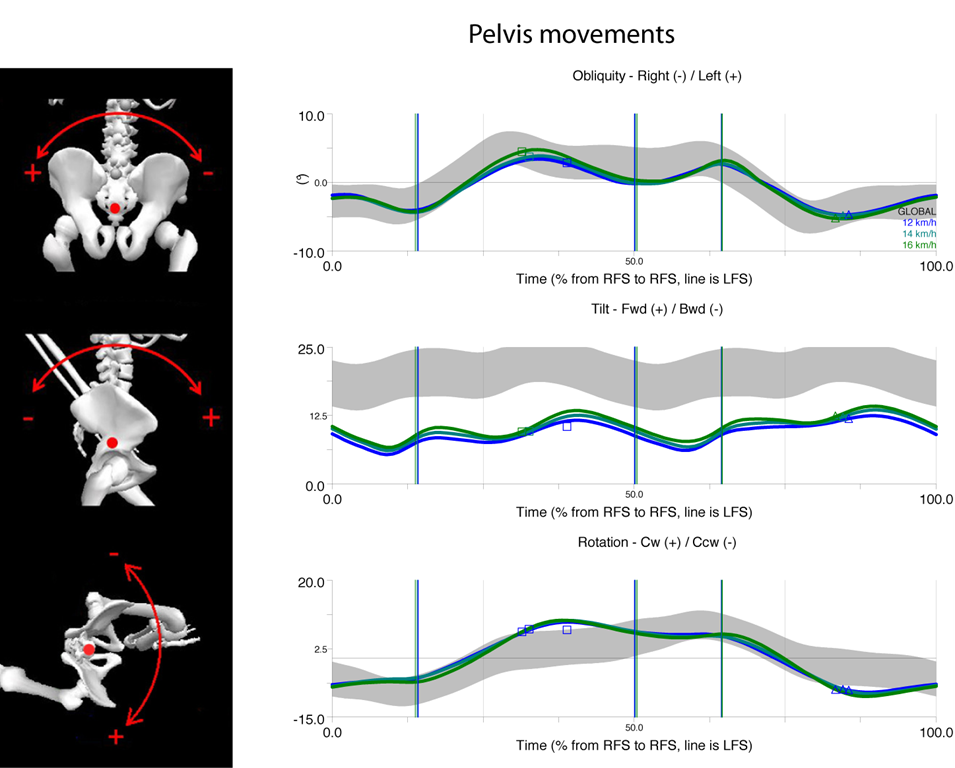
Above I talked about my relative shoulder-pelvis motion being within the norm. The same is also true for the pelvis obliquity and rotation, see Figure 7. Unfortunately, this is not true for pelvic tilt, where my pelvis is rotated way too much backwards; a very typical trait for people like me who sit too much. This messes up the whole kinetic chain and can lead to inefficiencies and potential issues such as overstriding or problems to get the leg behind the body.
Figure 7: Results for the different pelvis movements. LFS and RFS are left and right footstrike, respectively. The blue and green lines are my results for the different speeds, and the grey shaded areas are for the reference group of Swedish elite runners. For an explanation of the different lines and markers see Figure 5.
As it is often the case, the limited pelvic tilt is only the symptom of a cause which sits somewhere else. Based on his observations of me running on the treadmill and some extra exercises I had to do after the actual RunLAB analysis, Salming’s coach concluded that my limited pelvic tilt is caused by a very stiff upper back. Based on how I feel in my upper back when I do certain movements I am not surprised by this finding. It is, however, quite interesting when you are reminded that a problem which sits rather high up in the body can affect the running form in a substantial way. To increase my upper back flexibility, I received instructions for three special upper body stretches which I should include in the warmup before every run. These have helped considerably to reduce my perceived back stiffness. If this has helped with my pelvic tilt I cannot say right now as it is difficult to judge without an outside observer.
Additionally, my pelvic rotation is too high at toe off. This is the opposite of what was observed for my shoulder-pelvis rotation. This asymmetry means that the pelvis and the upper body are not really working together, leading to an unstable posture.
Excessively static arm motion
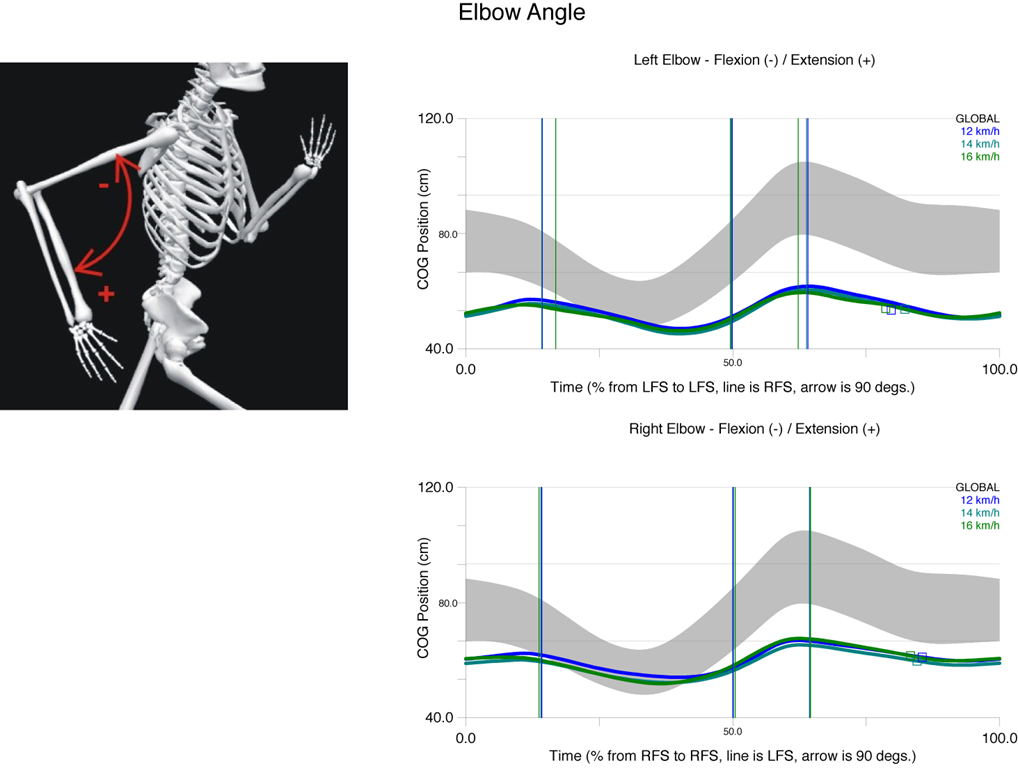
The second major critique that I got was that my arm motion is too static. This was partly related to not being relaxed enough in the shoulders and a slightly wrong chest posture. The major issue, however, is the elbow angle shown in Figure 8. Ideally, the angle should be larger when the arms are in the backswing behind the body, and smaller in front of the body. I tend to have a rather constant elbow angle irrespective of where in the swing cycle my arms are. Arm swing can affect the motion of the legs as well, so it is something important to consider.
I was told to be more aware of my elbow angle, especially at higher speeds, and that I should generally try to be more dynamic in my arm swing (but only the sagittal plane, not in the frontal plane, where everything was good). Following this advice, I can clearly say that my stride felt considerably more powerful at higher speeds. At lower speeds, however, I am struggling a little bit to find the right amount of dynamic motion. I very quickly get a little bit too dynamic which then lengthens my stride and lowers my cadence. More importantly, the correct arm motion will also help with getting my chest posture correct, which in turn will help with the position of the pelvis.
Linking things together
So, to sum up, there are actually some things which I need to fix in my running form, and somehow, they all seem to be connected:
· a correct arm swing helps to get a better chest posture and a better leg extension,
· a more flexible upper body is necessary for a better chest posture, and
· a better chest posture leads to a better pelvis posture and is necessary for the pelvis and upper body to work together in a symmetrical and stable way.
· This in turn will help me to have more control at faster paces which should also help me to get off my heels at higher paces.
Figure 8: Results for elbow angle. COG is centre of gravity, and LFS and RFS are left and right footstrike, respectively. The blue and green lines are my results for the different speeds, and the grey shaded areas are for the reference group of Swedish elite runners. For an explanation of the different lines and markers see Figure 5.
Conclusions
This post was my attempt to convey some of the parameters which are measured in a RunLAB session, and, more importantly, how these parameters can be related to more tangible aspects of the running form. I cannot stress enough that the few titbits I provided here are only a small part of the actual analysis. Furthermore, in the way I presented these few examples, there could be the impression that some few key parameters are sufficient for an assessment of a runner’s biomechanics. The reality could not be further from the truth. An assessment of the whole kinetic chain is only possible if the motion of all relevant body parts is considered. This is the great strength of the RunLAB, as it is a true full body running form analysis which looks at the runner literarily from top to bottom. Running dynamics data as delivered by wearable devices such as Garmin’s HRM-Run cheststraps or the RunScribe footpods can be very helpful, but it always only tells a (very small) part of the story.
The captured data is only a part of the reason why a RunLAB session can be such a valuable tool. The more crucial part is the expert coach who analyses and explains the data to the runner. Salming has very wisely decided not to put the data analysis in the hands of ordinary salespersons, but true experts in running biomechanics. The captured data helps the coach to make the right decision, and the visually appealing way in which the data is presented makes the analysis more accessible and more useful for the runner. The data and the coach complement each other in a perfect way: the whole is greater than the sum of its parts.
Regarding the potential benefits of the analysis I would like to bring up the case of my friend Jay, who joined me for the first RunLAB session and recently had his second session. His initial analysis revealed similar shortcomings in arm motion and pelvis position as I have. In his second session he had improved in both of these aspects; he could now could start working on the next area (glute activation) to improve.
Now while I am pretty positive about the RunLAB in general, there are some aspects where I see limitations or problems with the approach. The first, and maybe biggest, it the fact that the test is under “lab conditions” on a treadmill. On average I do less than ten real treadmill runs per year (not counting the few minutes at the running store trying shoes). That doesn’t mean that running on the treadmill is something I struggle with, but each time I step onto a treadmill I also have the sensation that my running form is changing slightly compared to running outdoors. In particular, I have a feeling that I heel strike more. So we have the typical science dilemma here: you are trying to apply findings from an individual lab situation (the treadmill test) to the more general case (running outdoors) which might have slightly different boundary conditions. For most runners this might be of absolutely no relevance, but there might be also other runners who run completely different on a treadmill than they do outdoors. That’s not a problem with RunLAB alone, but basically all tests done on treadmills.
Another aspect is the choice of reference group. Right now they are comparing results against a set of Swedish elite runners. Probably a good assumption as it is likely that someone who runs fast also has a good form (though there are exceptions). Still, an elite runner is also a different beast than your ordinary 30km/week runner. My tempo pace might be an elite’s easy pace, and that can have implications on their and my form at that speed. Now don’t get me wrong, I don’t think there is a generally problem with this particular choice of reference group, but it’s always good to have the context in mind.
Then obviously, the outcome of a RunLAB session might have the runner trying to change their form, with all the potential implications that entails. “If it ain’t broke, don’t fix it” is still a mantra many deem valid with respect to running form as every runner is so uniquely individual in their biomechanics. On the other hand, certain “running form rules” are surely more or less universally applicable: e.g. you will have a hard time finding a runner who benefits from overstriding. Still, there is a risk that a form change might mess up your body in an unexpected way.
I also emphasised that the analysis is nothing without the coach. Right now Salming has experts working with the RunLAB who know their biomechanics and running form and can analyse the data appropriately. This is probably a more important problem for making the technology even more accessible than just the cost of the equipment. You absolutely need to have the right people to work with it. This is probably the biggest reason why we can’t expect RunLABs to open all over the world in the near future.
Finally, to put things into perspective, motion capture analysis of running biomechanics is not really something new. However, Salming can be complimented on making the technology and the expert assessment better available to the general public. The price is not cheap, but reasonable for what you get (at current exchange rates $220 for one session, or $330 for two), and not having to go a special testing facility (like a university lab) for the assessment but just your ordinary local running store certainly also helps.
Disclaimer
The RunLAB session was provided to the author free of charge by Salming Sports AB Sweden.












Carsten, can you describe the 3 stretches you were given for your upper back? I too sit all day and am having problems in part due to that.
Jim, these are the three exercises they have me doing:
* Cat back stretch 2×10: Example: http://workoutlabs.com/exercise-guide/cat-back-stretch/
* Upper back stretch 2x30s: Example: http://www.weightlossforall.com/stretching-upper-body.htm (further down the page)
* 2×10 stretches no. 4 from this: http://ehs.ucsc.edu/programs/ergo/stretch.html
Note that really nicely made exercise descriptions are part of the webreport, however, they are only accessible in the version the runner seems when logged in to Salming’s site and not in the version they can share with other people. Because I didn’t want to get any copyright problems I used examples from other sites instead.
Thank you. I’m already doing the first one, several from the second link, and will incorporate the one from the 3rd link.
You can toggle between swedish, english and german in the upper right corner in the webreport from Salming. If you use the link to Carsten’s webreport then you can see video of the 3 stretches given for the upper back
Great article and I share your intuitive sense that treadmill analysis may not be a true reflection of your running style “on the ground”.