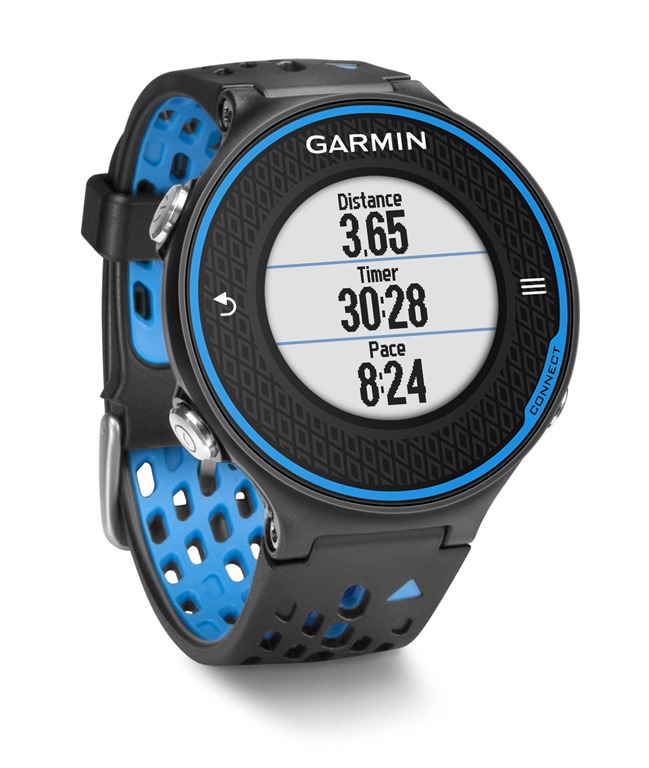
 I’ve been working on a long overdue review of the Garmin Forerunner 620 – it’s been a tricky GPS watch to review because it does so much, but also because I’ve had some issues with it. One of my original reasons for buying the 620 was that I was interested in the ability to record data on running dynamics (i.e., biomechanical data) via the paired HRM-Run monitor. As part of the review I had included a section where I shared some running dynamics info from a few of my runs, but as a result the review was becoming incredibly long. As such, I thought I’d break out the running dynamics into a separate post here.
What I’m going to do is share data from a few runs that revealed some interesting patterns to give an idea of what you can learn from the device. I still find the data more a curiosity than something I would use to make changes to my form, but it is interesting to play with the information!
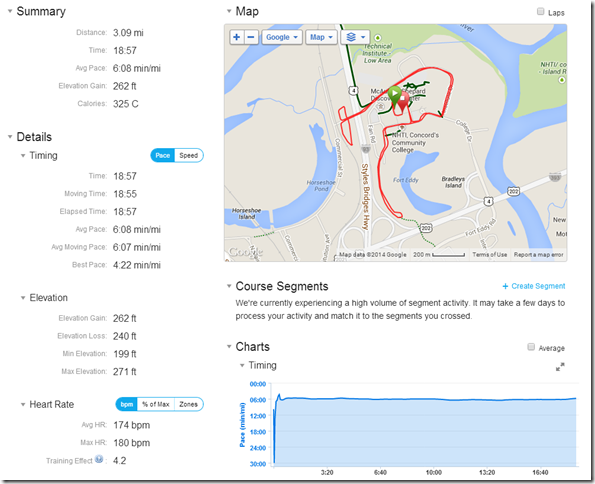
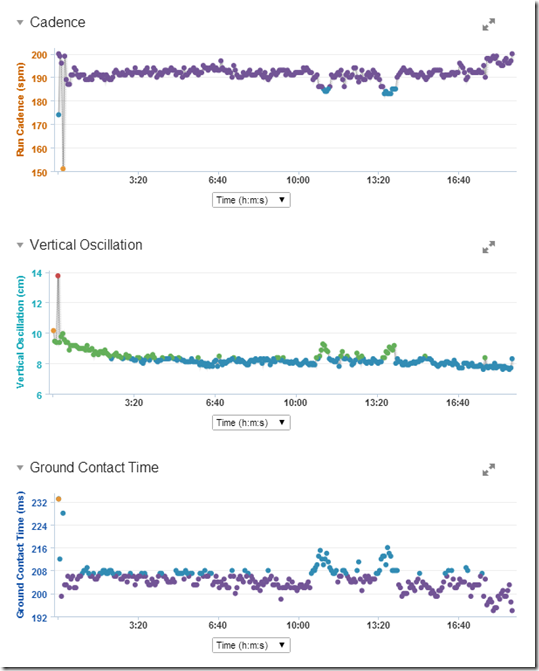
First, let’s take some data from a near-PR 5K I ran back in April – below you’ll see the run summary info and GPS track, as well as graphs for cadence, vertical oscillation, and ground contact time (GCT) all estimated by the HRM-Monitor:
For frame of reference, here’s how Garmin breaks down running dynamics across a range of runners ((note: I’m not sure exactly how Garmin determined these groupings):
Looks like my cadence and ground contact time during the race were on the high end (mostly purple – >95 percentile), whereas vertical oscillation was more middle of the road. This suggests to me that I have a short, quick stride with a moderate amount of up and down movement (assuming the HRM-monitor provides an accurate measure of vertical oscillation).
What’s kind of cool in the above graphs is that right after the 10:00 mark we went up, over and down an overpass, then returned over that same overpass just after 13:20. You can see how my cadence, vertical oscillation, and GCT changed going up and down the hill. You can also see that my cadence trended upward, and oscillation trended downward over the course of the race (presumably in part as I sped up at the end).
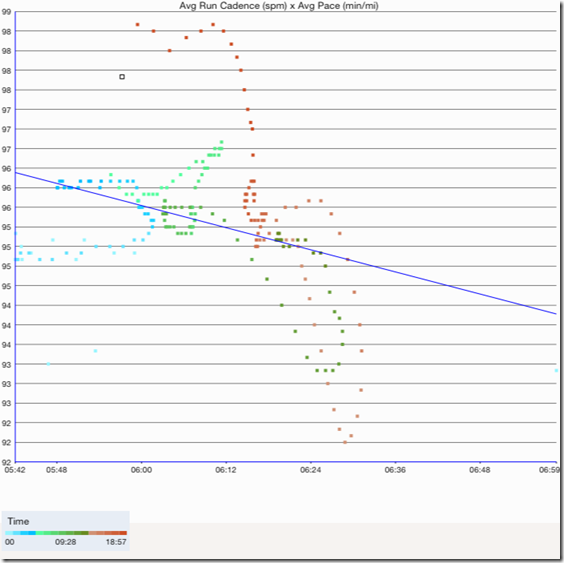
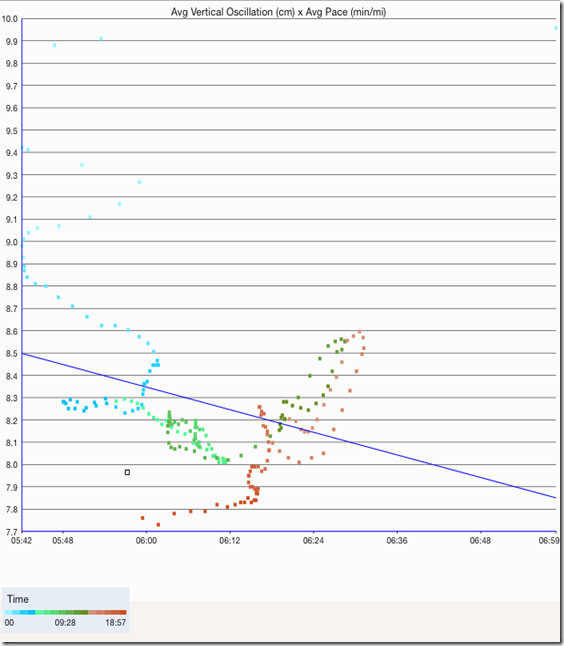
For an even more interesting view of data from the same race, I pulled the following graph off of the Connect Stats app, which pulls data from Garmin Connect and lets you look at it in different ways:
In the above graph you can see how my cadence changed from the beginning (blue dots) to the end of the race (orange/brown dots). You can also see on the right are two downward loops that probably represent the overpass mentioned above. What I find particularly interesting is that at the end of the race my cadence shot up way higher than it was at the same pace earlier in the race – wondering if this is a way of compensating for fatigue (it was a pretty flat course except for the one overpass so terrain doesn’t seem to explain this)?
You can see a similar pattern with the vertical oscillation data in the graph below – greater oscillation early in the race, less toward the end, even at similar paces run earlier on – perhaps I had to compensate for reduced air time by increasing my turnover?
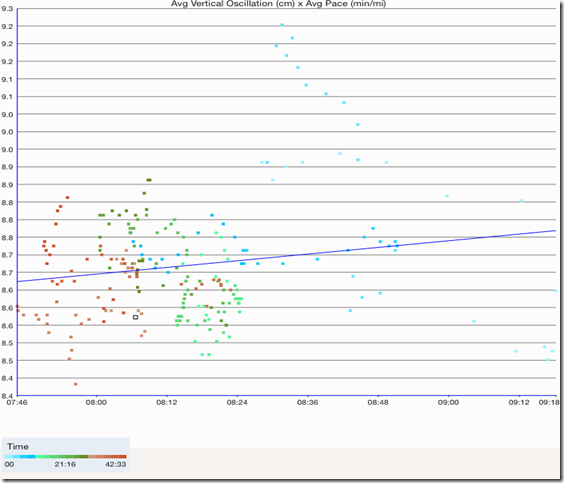
Here’s one more graph from a different run (also in the Spring) that I found interesting:
This one was from an easy training run, and I was puzzled by the higher vertical oscillation at the beginning of the run (light blue dots). After a bit of thinking over a few runs I realized that my left knee had been bothering me at the time. When it does I often accentuate a forefoot strike and stiffen my leg on that side at the beginning of runs. However, once it warms up I settle into my more typical stride mechanics. My guess is that the early numbers represent modified form until I warmed up. Pretty cool, and suggests that you can get some interesting data from a device like this. I’m still not sure how accurate the numbers are, but I do think they are at least representative of general patterns, and there seem to be plausible explanations for some of the unusual patterns observed.
I’m curious now to try out the HRM-Run monitor for a comparison between a few different shoes – perhaps Hokas versus something more minimal. May just have to do some experimenting!
Have any of you played with the running dynamics data on the Forerunner 620. Any interesting patterns observed?








I’m waiting for my Runscribe to arrive to compare what it measures to Garmin’s run dynamics. I presume that Runscribe will be more accurate as it’ll attach directly to the shoe.
Thinking about it, the vertical oscillation will probably be more accurately measured in the HRM belt, whereas ground contact and cadence will be more accurate from the Runscribe…
I have been looking for a new HR/GPS monitor. I bought my Forerunner 410 three years ago. Now I have been looking at the possibilities and there is just so much to choose from.
What I really am interested about is the running technique analysis. Runscribe seems interesting but so does the Zoi from Runteq also. Check their Indiegogo site link to igg.me Zoi has two sensors. One for the chest and other one on the shoe. I would expect to get more feedback based on the whole body with this Zoi.
I really like the idea that I would get running technique analysis on a daily basis instead of a half an hour run at some running lab’s treadmill.
I got the Mio Link, and that was the end of Running Dynamics.
Same here, wrist-mounted HRM makes it hard to go back to a chest strap.
Brian and Peter – I feel the exact same way. I was so excited about running dynamics and the HRM-Run, but from the first run with the Mio-Link, I knew there was no way I was putting on a chest strap again.
Your thought about different shoes is an interesting one.
I am in the middle of transitioning from VFF SeeYas to Altra The One2.
I’ve run almost exclusively in VFFs since I started running and found that, though I am slow in pace, and just about average in cadence (usually in the 170 – 175 spm range), I generally am in the purple in GCT and VO.
The first few runs in the Altras my GCT and VO were quite a bit different – I generally in the blue and sometimes green ranges. After about 30 miles and some adjustment to the new shoes, I have seen the numbers settle back into my usual pattern of being comfortably in the purple range for both measures.
Great post! I have also been looking at the running dynamics since last December. I have noticed a few things:
– For me oscillation is heavily dependent of fatigue levels. After a few days of heavy training, oscillation goes up by 1cm. Also, when it’s really hot oscillation changes.
– Increasing cadence has lowered my avg oscillation. I have worked on increasing my cadence. Last year, I averaged 168-170 on a typical run. Today, I run at 180-185 when I have fresh legs. Oscillation is substantially lower.
– I have not noticed any difference between shoes. My current fleet includes five different models ranging from minimalist to more cushy.
The big question for me is what metric one should focus on to improve running form? In my case, cadence seems to influence oscillation. GCT is influenced by speed and strength.
Very interesting post. It is the first time I see a real use of the new information provided by the 620. It seems reasonable that you tried to compensate fadigue by changing the way you ran. This post has everything to become one of the most popular ever and I would suggest you do more research on this topic, since it is very difficult to find anything.
In addition to comparing the data between various shoes, I would like to see it compared to running barefoot. I have the 220 and have done that but it only measures cadence. I wonder how ground contact and oscillation change when barefoot. My cadence went up while barefoot. I did it for 400m on an outdoor track. Ran a lap in shoes and immediately took them off and did one barefoot.
Pete,
I tried the HOKA (Clifton / Huaka) comparison with Merrell (Bare Access 2 / Bare Access Ultra), for me it is very hard getting clear conclusions…
The trend is for slightly more vertical oscillation with HOKA and slightly longer stride lenght, I would have to draw averages for many runs in order to give numbers but by looking at some runs quickly, I’d say 0.2 to .04 more vertical oscillation with Hoka and 0.05m longer stride lenght.
I feel ground contact is longer with Hoka but the numbers don’t confirm it ! I get similar numbers with my Hokas !
I was also hoping to see quicker cadence and lower ground contact with Huaka over Clifton since it is what I feel, but I’m not seeing differences between the two Hokas (though I feel faster in Huaka).
Looking forward to seeing your results. I’ll try and work on compiling results on my side ;-) .
Hi, I am really thinking about buying this, but I am not sure if it is necessary to invest in it. I have now basic heart rate monitor and tracking my distance with endomondo, but it is not really precise…. Would you recommend me this garmin or do you know about some better app? Thanks for answer ;)!
iSmoothRun is a great app. There are also cheaper Garmin options if you just want pace/distance – the FR15 might be worth a look.
I’ve used Connect Stats as well (and Garmin Connect and Strava). I ended up writing my own GPS watch data analysis website which looks at your data in yet another way. I actually wrote the website for me, to analyze my training runs better. Hopefully it will be meaningful to others. Check it out: http://www.GraphMyRun.com. It’s free and certified secure. I’d love feedback on how to make it better. Phil
The new Garmin 920xt has running dynamics also through the HRT-run chest strap. Some of the data in the running dynamics can actually help improve your running, and especially deal with knee injuries as above. I’ve explained a little bit about it on http://www.titaniumgeek.com which suppliments this.